

For those of you who are not fans of Bill and Ted’s Excellent Adventure, all I have to say is, “I’m sorry.” Those who are fans will get the reference above. It reminds me that we lost a really great comedian in George Carlin.
Speaking of losing someone, we lost a giant on the big screen today, Robert Redford. So many great movies he was in – All the President’s Men, The Sting, and The Natural just to name a few. RIP!
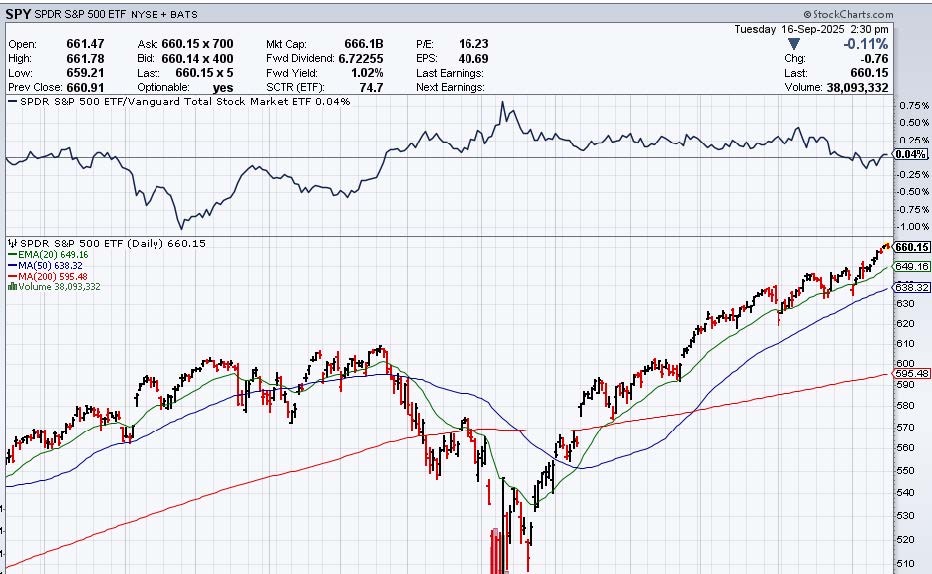
“Circling” back to strange things, the AAII survey is an odd one. Usually when the markets are at highs, so are the sentiment indicators. Not so this time. Here is the S&P 500, where you see this key index making all-time highs.
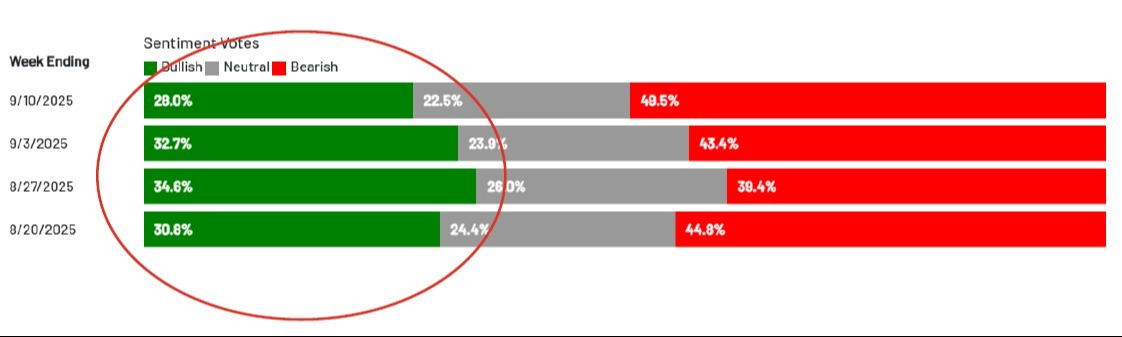
Meanwhile, here is the AAII survey over the last few weeks, where you see relatively low levels of bullishness.
Maybe this sentiment indicator (one of many, mind you) is on the right side of things this time, but it’s not squaring up to our model or other sentiment models. Take this for example. The Advisor and Investor Model that is captured by SentimenTrader.
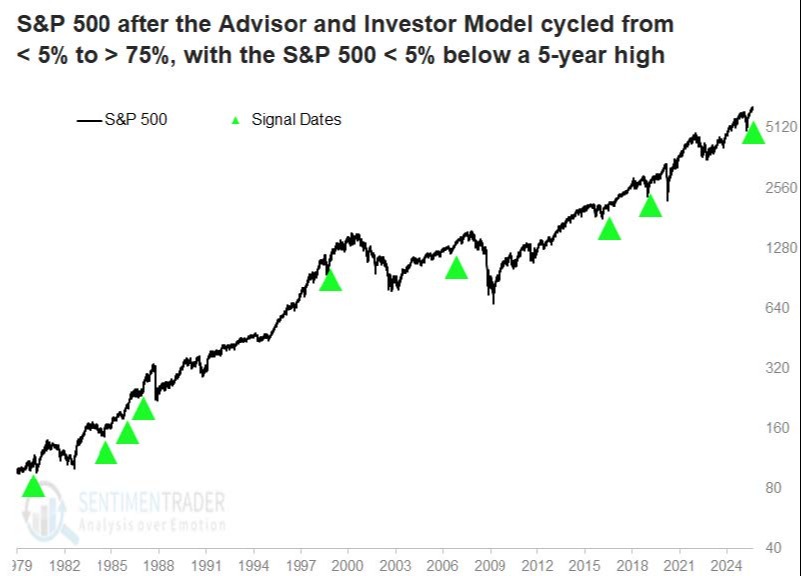
Most time periods following this trigger (green triangles) are positive, except 1-year out from January 1987. In case you don’t remember that, it was in the middle of Black Monday, where the S&P dropped over 22% in one day. It spent the rest of the year and subsequent year coming back from that drubbing.
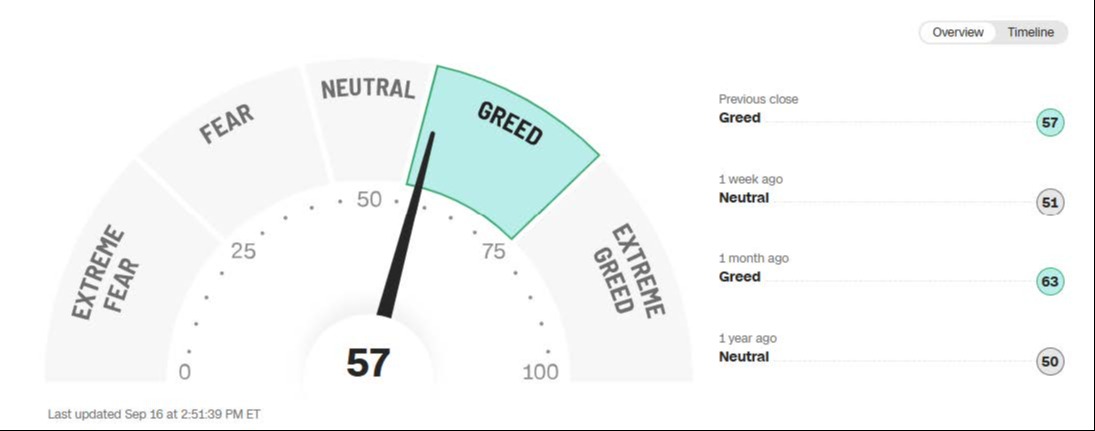
The CNN Fear and Greed Index is showing more of what I would expect. Not terrible, but slightly in the “greed” category.
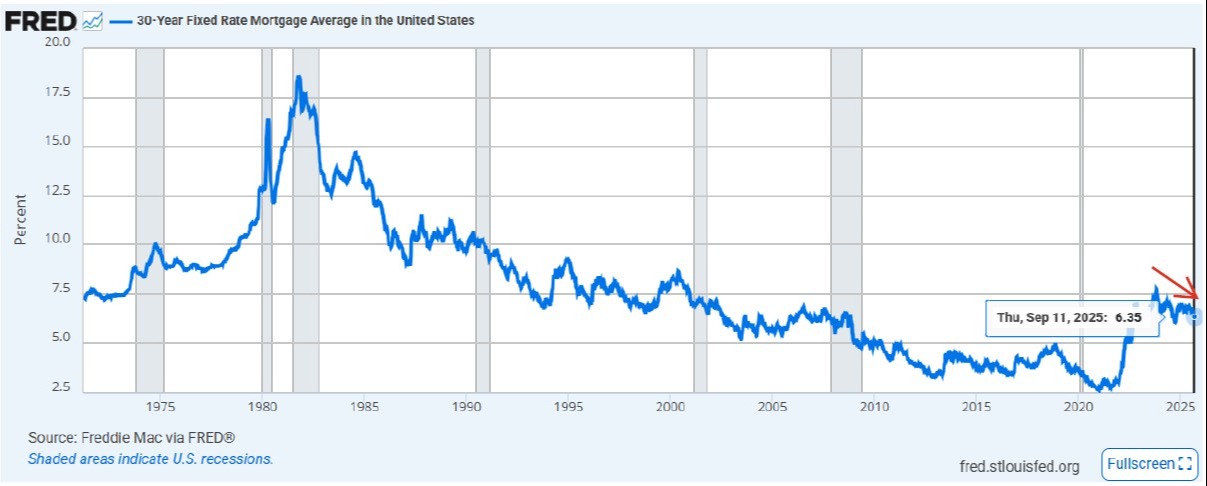
Tomorrow we have the highly-anticipated FED meeting, where they will likely reduce interest rates by 0.25%. Odds are so high in the market’s eyes that much of tomorrow’s likely cut has already been factored into mortgage rates, as rates have gone down a half a point since June 5th.
The bigger question is whether we see inflation from tariffs or inflation being kept at bay due to a slowing economy. I think you know where I fall on this argument.
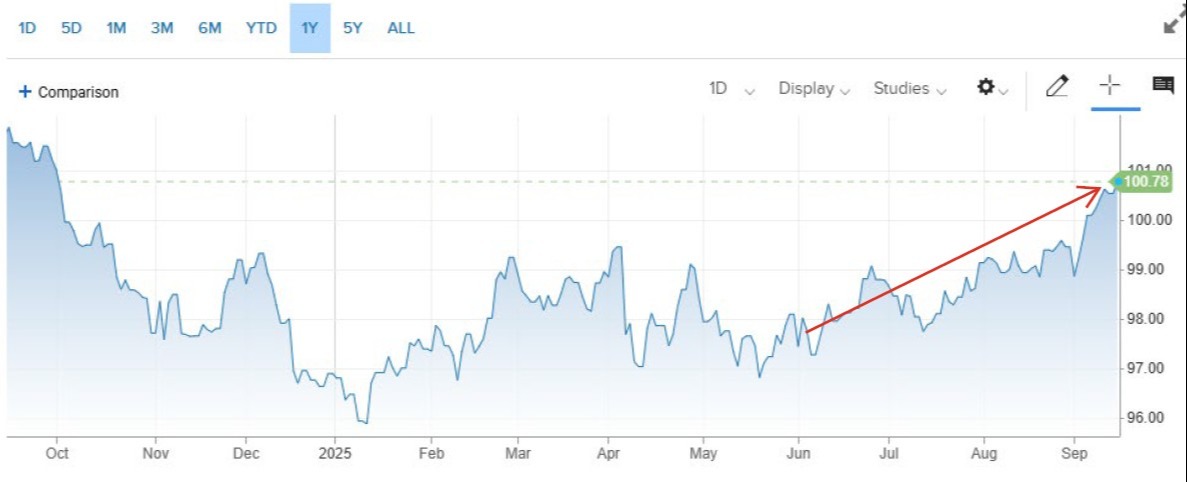
The biggest effect will be on money market rates, as most rates are within 90 days of maturity. Most longer maturity bonds have already seen a nice increase in price, which corresponds with a drop in long-term rates. Below is a chart of the US Aggregate Bond index. You can see that from June it has largely recovered from the inflation fears of 2024 and they are actually higher than April 1st when the tariffs became a thing.
That’s it for this week. Please let us know if you have any questions or comments about this or any other topic. We will be happy to have a conversation.