

We know that the markets appear to be fully valued, if not overvalued. At the same time, the markets, as they are famous for doing, continue to climb the proverbial ‘wall of worry.’
Here’s a chart of the ‘Buffett indicator’ that is now at its all-time high (including the tech bubble).
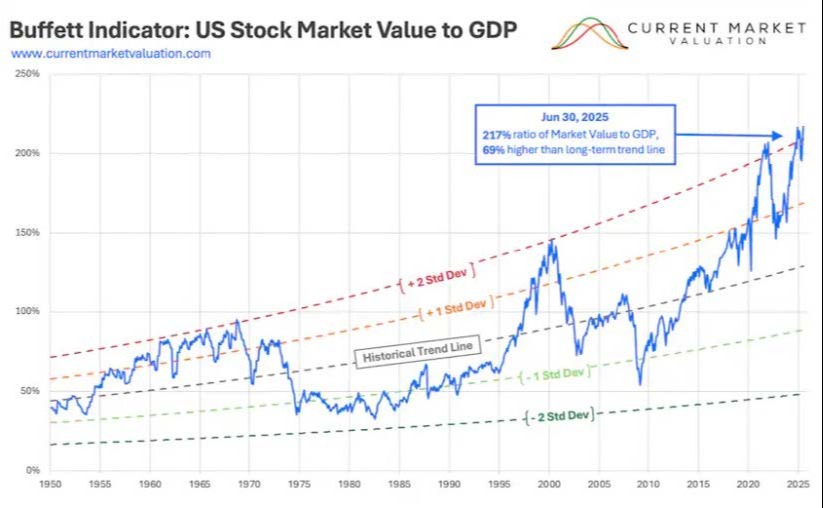
It’s no small wonder why Warren Buffett has $300+ billion in cash. It may not be because he thinks the market will crash, but it could be it’s just hard to find good values in the market today, especially values that will move the needle for a company as large as Berkshire Hathaway.
Here’s another view of market valuation. Instead of ‘Market Value to GDP’ (which the Buffett Indicator shows), the chart below shows ‘Price-to-Book Value’ of the S&P 500.
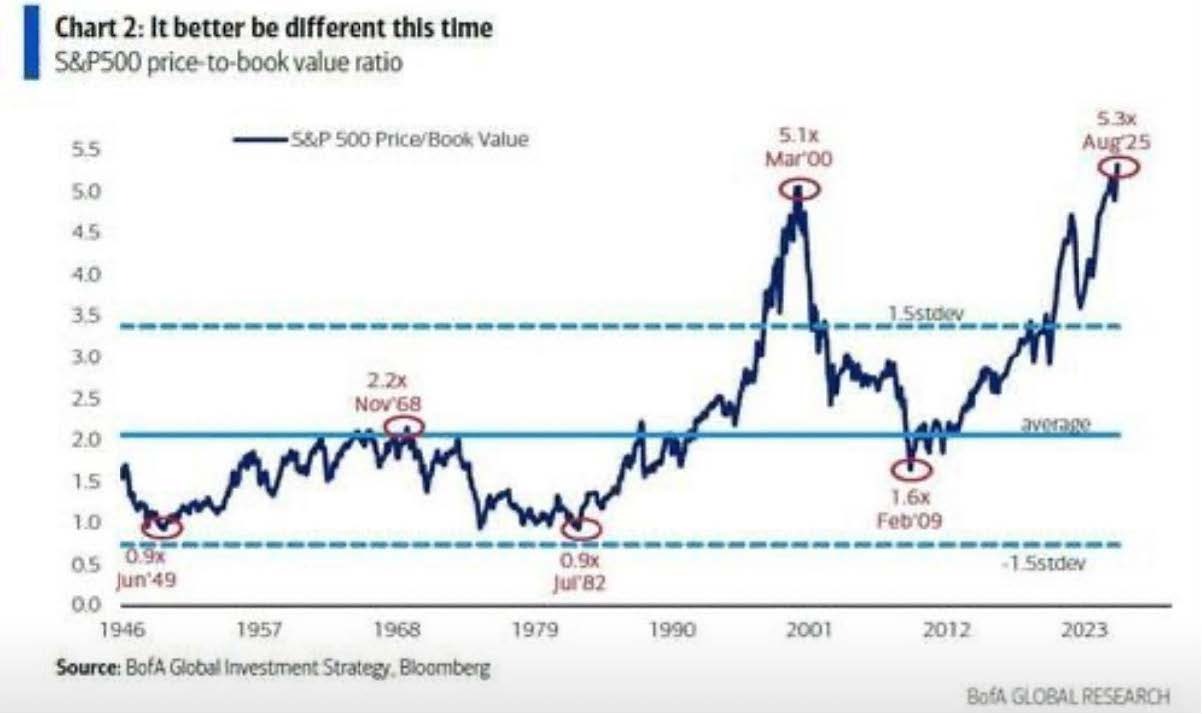
These indicators are not great for market timing, just valuable to look at overall pricing of the market.
Here is a chart of the S&P 500 overlayed with a chart of the tech bubble.
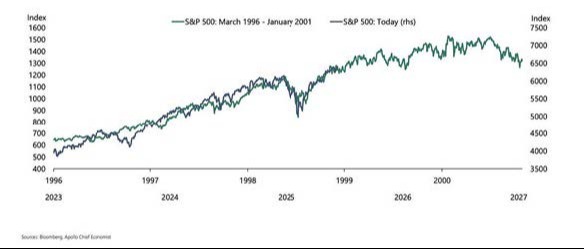
Just because it looks the same doesn’t mean it will necessarily have the same outcome. Remember, back in the tech bubble there were many companies that didn’t have earnings. Today the market is backed by companies that have a tremendous amount of earnings power behind them. So, it’s not an earnings issue, but more of a valuation issue. How much do you have to pay for a dollar of earnings?
As it turns out, quite a bit. Take the top 100 companies in the S&P 500 (the S&P 100) and this is what you have to pay for earnings right now.
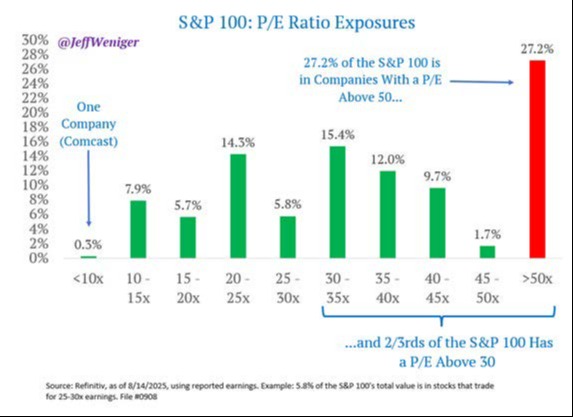
Two-thirds of the companies have P/Es above 30 and over 25% over 50 times earnings. That means that if you buy a share, it would take you 30 -50 years to recoup your investment at today’s earnings. That’s expensive. Again, this doesn’t necessarily mean the market will fall apart tomorrow, just that you are paying a lot for those top 100 stocks. This is largely backed by retail investors who have been plowing money into large cap stocks at an unprecedented rate. Are they wrong? Maybe not.
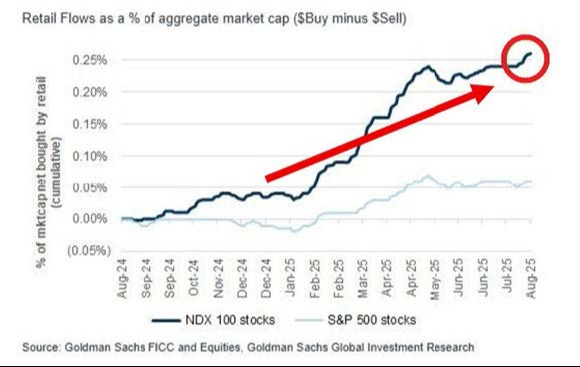
You can see that starting in January of this year, retail investors really started to add a lot of money to both the S&P 500 and the Nasdaq 100 (tech stocks).
We use our money flow data to tell us whether stocks should be bought (safer time to own stock) or if we should be more conservative with our allocation. Right now, it’s saying safe to go into the “stock” waters. That could change, depending on what happens in the near future. Remember, we discussed the chance of a whipsaw if the market decides it wants to start going down. We won’t know until it happens, but it’s something that we look at every day.
As always, please let us know if you have any questions about this or any other topic. We will be happy to have a conversation. Otherwise, enjoy the remaining days of summer.