

Happy 4th of July week. If on this holiday shortened week, you are looking for my commentary on last week’s presidential debate, you can stop reading here. I’m not going to comment on the debate other than to say the ‘market’ will be the final judge of an administration’s economic policies. For the last 40 years, we’ve had policies from both sides of the aisle that have largely spent more money than we had. Here’s a great chart to see how many times the government has had to increase the debt ceiling.
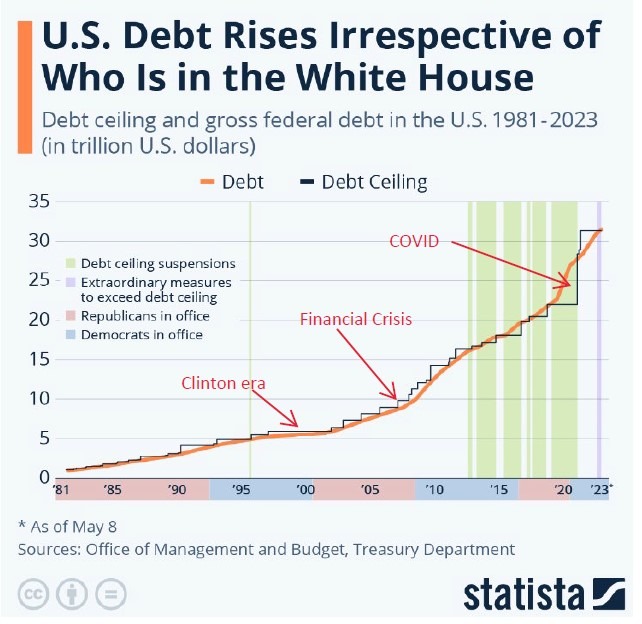
You can see the one time in the late 90’s where we briefly had a budget surplus (not large enough to show a dip in the debt), but many years where the politicians didn’t have to raise the debt ceiling. Then, of course, there was the policy response after COVID. The debt ceiling was raised by $8 or 9 trillion. Now of course we are closing in on $35 trillion in total debt. That’s a very big number by any measure.
I’m not saying that either party is solely responsible for this. I am saying both parties are responsible for this. But since the financial crisis (08-09), things have gone into overdrive, with the debt going from around $9 trillion to almost $35 trillion.
The big question comes back to how long can we continue to spend more than we bring in? There is a definite answer for individuals, as we all have a limit on how much the banks will loan us. The government can print all the money it needs to finance these deficits. Some say there are no repercussions. Others say there is a limit. I suspect we will find out in the next 5-8 years (always seems to take longer than you think).
We are, however, seeing the economy slow down and consumers slowing their spending.
The big news last week on the economic front was PCE (Personal Consumption Expenditures) came in flat on a month-over-month basis. If you take out food and energy, the index rose by 0.1% from April. That brings the year-over-year number to 2.6% (down from 2.7% the month before).
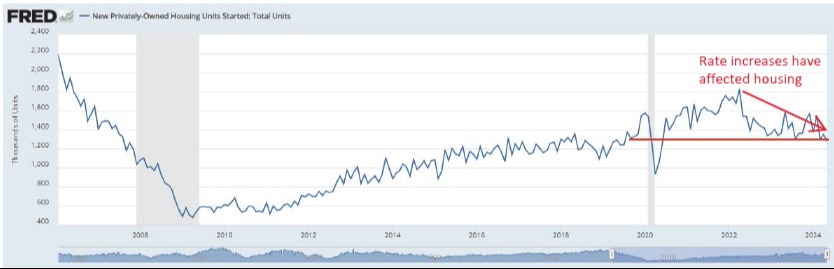
That’s not the “2%” the FED is looking for, but it’s getting closer. Not only that, but housing starts are continuing to be weak and the Purchasing Managers Index (PMI) continues to hover below 50, which signals a slowdown in business purchasing.
Today, the ISM Manufacturing index came out weaker than expected at 48.5. Under 50 is signaling a slowdown.
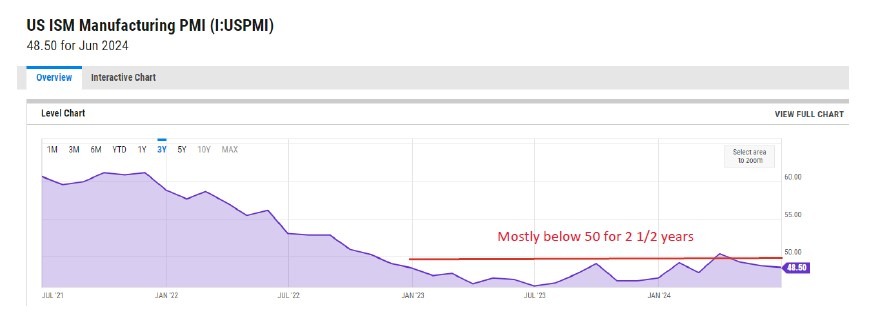
You can see that the index has been weak since 2022. Housing starts haven’t been this weak since COVID (and really before).
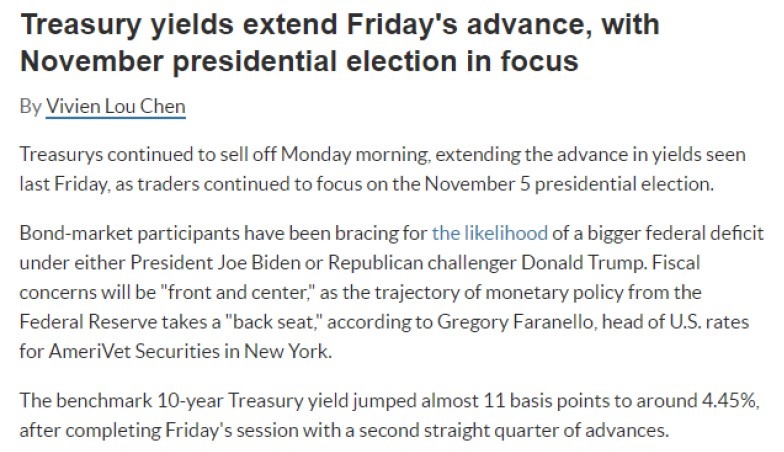
So, while so many economic indicators are weak, suggesting a slowing economy, why is the bond market also so weak? Remember, bond prices go down when yields go up.
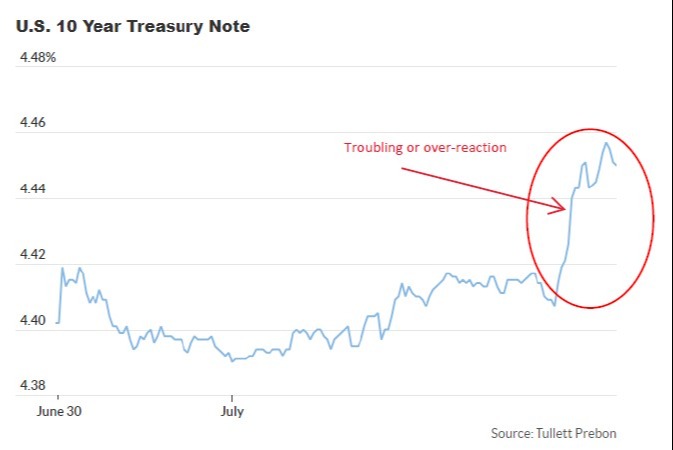
At least according to a note on MarketWatch, bond traders are concerned about the possibility of either party winning the White House and subsequently running bigger deficits. Wow, in their eyes, it’s not even a matter of who wins!
But the bigger issue is more about how much can the government borrow before the debt service gets too large to handle? We already know that debt service is now the third largest item in the budget. Only trailing Social Security and Medicare (yes, bigger than defense). And we know we are borrowing a couple trillion dollars a year at this point.
Will anybody be willing to stick their neck out and say that this isn’t sustainable? More importantly, there have been many people to say that, but very few who have really tried to do anything about it. More than likely we will need a ‘crisis’ in order to bring politicians to the “rescue.” Never mind their rescue is for something they created.
Well, that’s it for this week. July 4th is on Thursday, I hope you enjoy the holiday safely. Say what you want about Presidential politics, it’s still very clear to us here at MPCA that we all have a lot to be grateful for as citizens of the USA. Reach out if you have any questions!