

You may be laughing at that headline, as it often seems that making any sense of economic data is a fool’s errand. Like most data, you can “make sense” of it in whatever way you wish to fit your preferred narrative. With that said, we’ll try to remove any bias and actually make sense of the data we’re looking at today. You can be the jury as to our interpretation.
Last week I discussed the FED’s preferred inflation metric – the Personal Consumption Expenditures (PCE). I noted that inflation as measured by the PCE was down below 3% and, in our view, given where we are in the cycle will likely continue to slowly decline toward the 2% “target.” We also said that the 2% number is completely arbitrary and isn’t really that important in the big scheme of things.
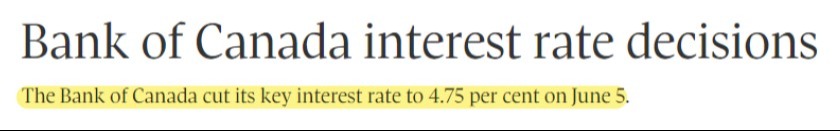
Since last week, we saw the Bank of Canada be the first to lower central bank interest rates.
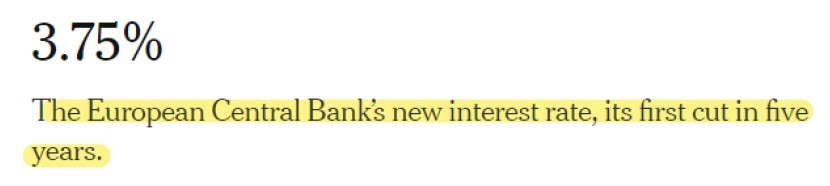
A couple days later, the European Central Bank (ECB) lowered interest rates by a similar 0.25%.
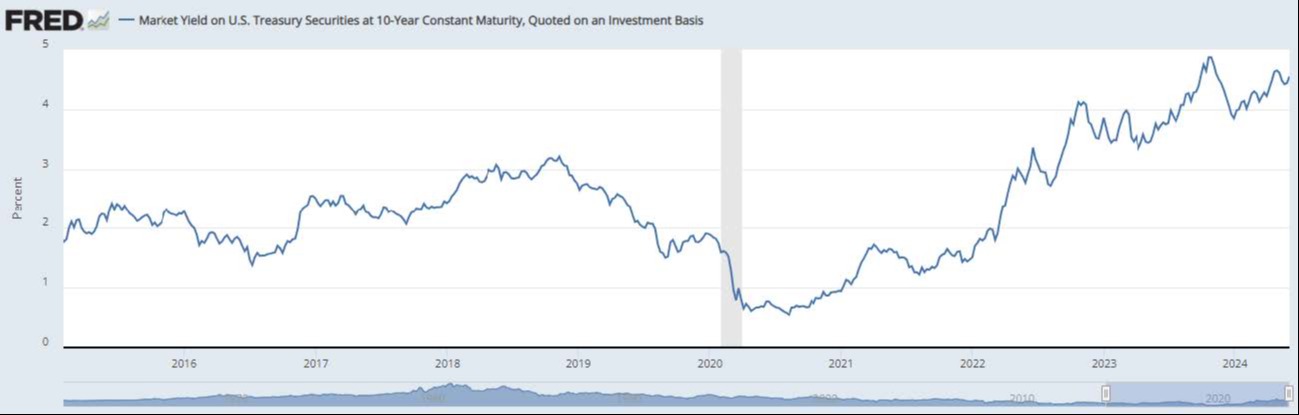
Back home, late last year we saw 10-year interest rates come down from highs in October, bottoming in December. A rally in bond prices coincided, as would be expected. Since then, rates have moved back up toward the 4.5% level, and bond prices have wavered, again as expected in such circumstances. We know that the CPI, PPI, and CPE are driving to some degree the 10-year Treasury level.
But also employment is driving the 10-year yield because the FED has said they will use labor weakness as “proof” that their restrictive monetary policy is working.
That’s where things get a little wonky (yes, that’s a technical term). It helps to look at a little flow chart.
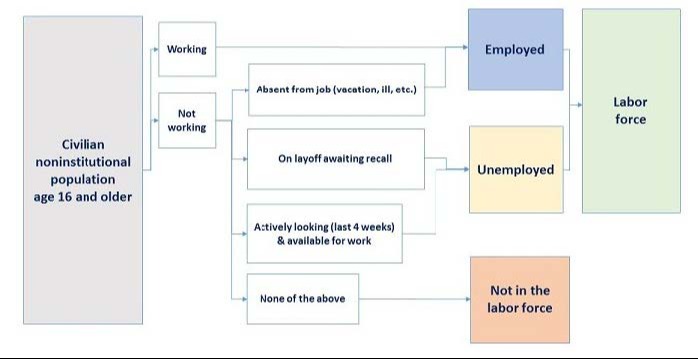
Here is the definition of CLF.
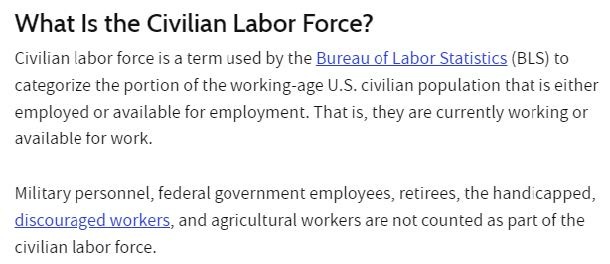
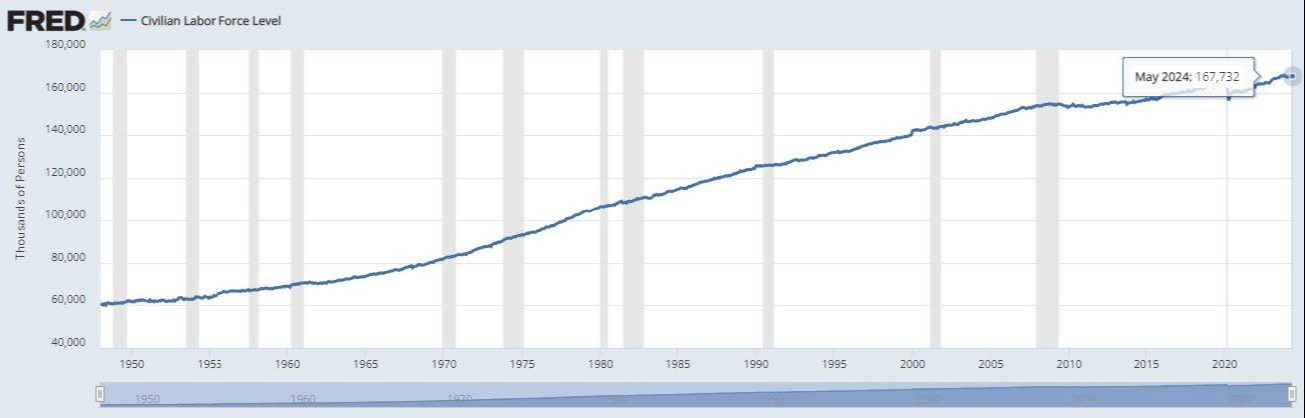
Here is the size of that population - 167,732,000.
From there we have to follow the flow chart above.
People are either working or not working. Easy enough, right? No, this is the government, so it’s not that easy. We need to exclude certain people from this calculation.
If unemployed, you are either laid off and awaiting recall or you don’t have a job and are actively looking for a job. And that’s the key to the whole equation. It turns out, if you are not “looking” for a job, the government doesn’t count you as unemployed. Often times, those people are considered “discouraged” workers. Basically, they gave up looking for a job because they couldn’t find one.
That’s how we get to the unemployment rate. It’s the number that hits the headlines.
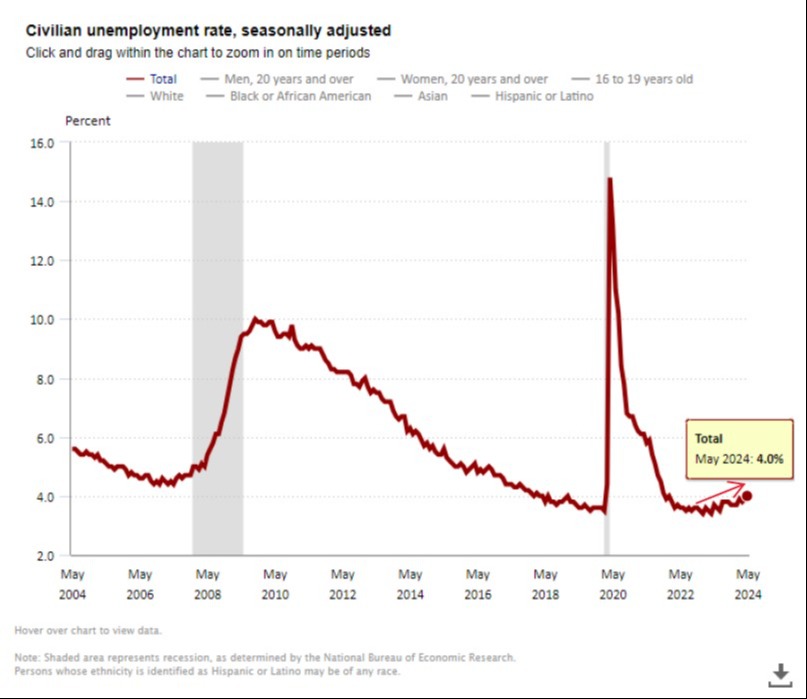
That number is now up to 4%, rising from the low of 3.4% in April 2023.
But if we add back in the discouraged workers or those that are “underemployed” the numbers get quite a bit bigger.
Here’s a chart that includes the U-3 (headline unemployment), U-5 (includes marginally attached workers), and U-6 (includes discouraged workers).
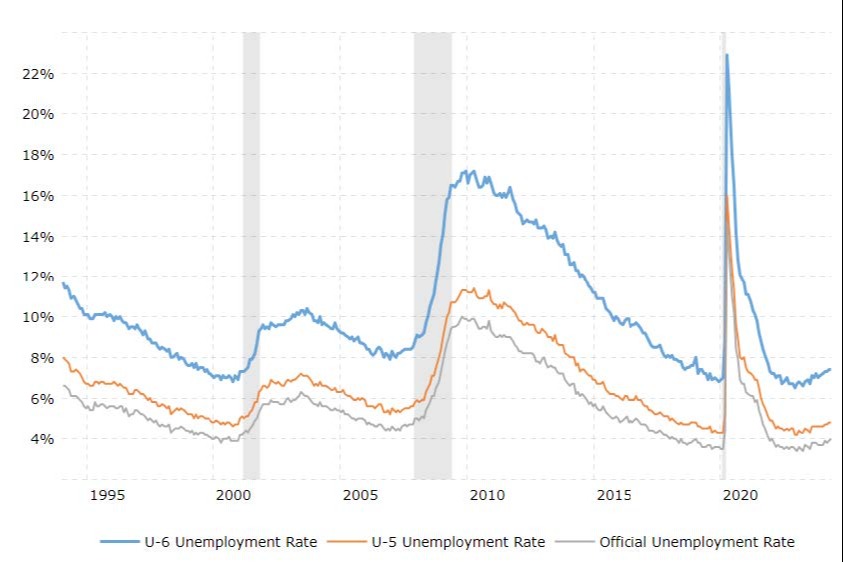
You can see all of the unemployment rates have been moving higher over the last year, with the U-6 rate at 7.4%. That is better than the average rate, but almost 1% higher than the lows in April 2023.
So, last week we got a stronger jobs report than the market was expecting and that sent interest rates higher.
The question remains, which is correct? Strong labor market or higher unemployment? I think those can’t both be correct. Our bet is that there is funky data in the jobs numbers that then later gets revised down. In the meantime, the unemployment rate starts going up and everyone gets focused on jobs but, as we’ve said before, they count three part time jobs as three new jobs even though they may only pay the equivalent of one full time job.
Europe and Canada have already started cutting rates and the unemployment rate in the US has started going up. Remember that the unemployment rate is a lagging indicator. The leading indicators have been telling us for a while that the economy is slowing down. The April LEIs were down 0.6% for the month and still significantly negative on a year-over-year basis.
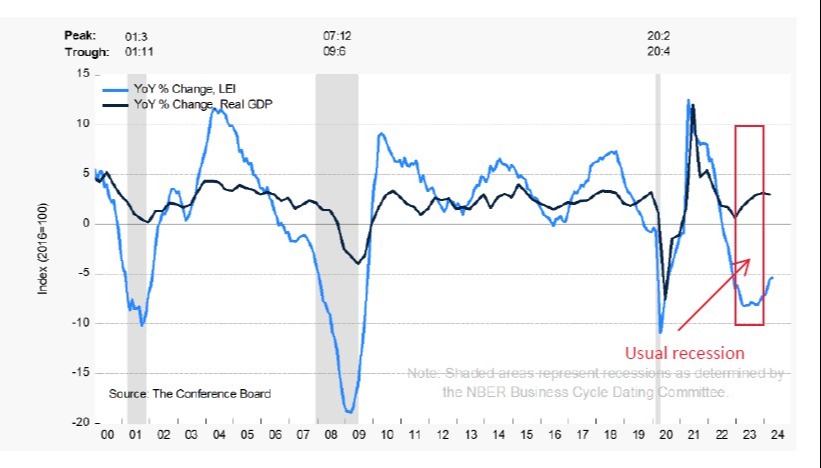
Usually, we would have seen a recession by now as shown by the gray bars below. My guess is the amount of deficit spending has largely propped up the economy for the last year or so, as peoples’ COVID savings has dried up.
That’s it for this week. We hope the aforementioned jury has judged us favorably. Regardless, we wish you a good week. Reach out if you have any questions!