

In case you weren’t paying attention yesterday, the Seahawks are going to the Super Bowl in a couple weeks to play the Tom Brady-less New England Patriots. Should be a good game, but I’m going to go out on a limb now and say that the Seahawks will win – and Marshawn Lynch will be on the sidelines reminding coaches to just run the ball at the goal line! Not because I’m a homer, but I do think they are the better team. The score will depend greatly on whether the defense can lead to some points. If they don’t, it will be a relatively close game. Go Hawks!!
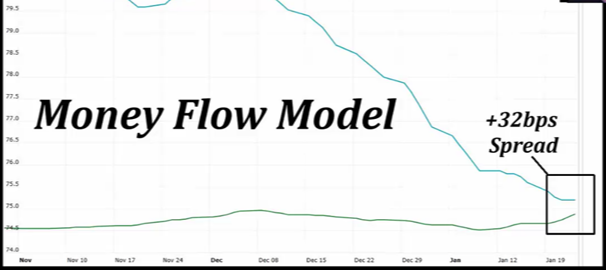
Now on with real business. We mentioned several weeks ago that our money flow data that helps drive our model was getting closer to turning, and today it continues to get closer to flipping from “risk-on” to “risk-off.” What does that mean? Basically our model points to higher volatility in the markets and it is sort of like driving a car around a sharp curve. Best to take your foot off the gas until you get around the curve, unless you want to end up off the road.
Now in full disclosure, we are not yet to that point. So this is a bit forward looking and we don’t want to jump the gun in case the model widens again.
Most of our longer-term models still point to a favorable environment, such as the AAII data we cite often in these missives.
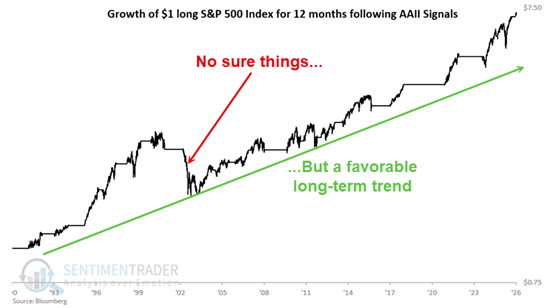
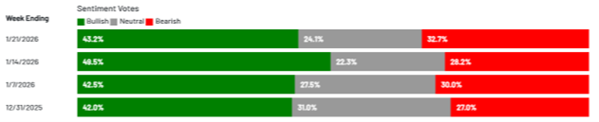
This looks at the AAII survey for a drop below 44, then stays above 44 for more than 3 consecutive weeks. Here’s where we’re at now.
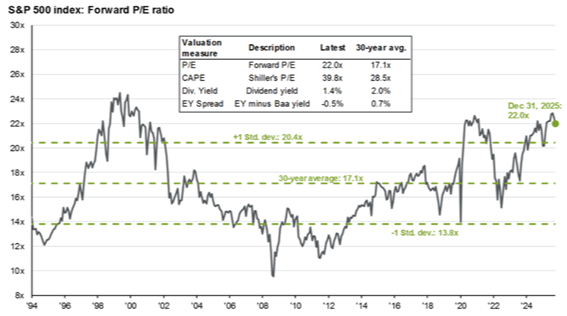
The last trigger was a little over a month ago, so according to this model we should expect 12-month prices to be higher. Is the market setting up for a weaker period before resuming an uptrend? Not sure. Valuations are elevated, though not as high as they have been in the past.
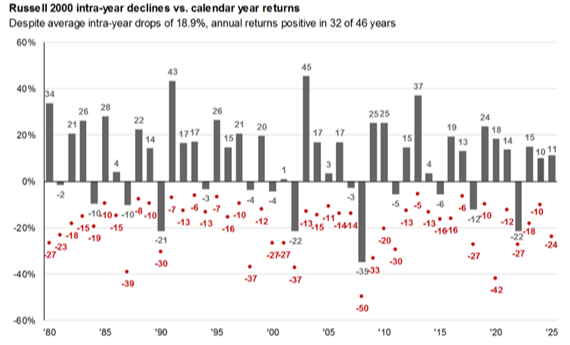
Here’s a look at downside volatility for the Russell 2000 (small cap stocks). You can see that it’s not uncommon to see 15%-20% drawdowns even when the index finishes higher.
This next chart looks at market cap weighting versus equal weight for the S&P 500.
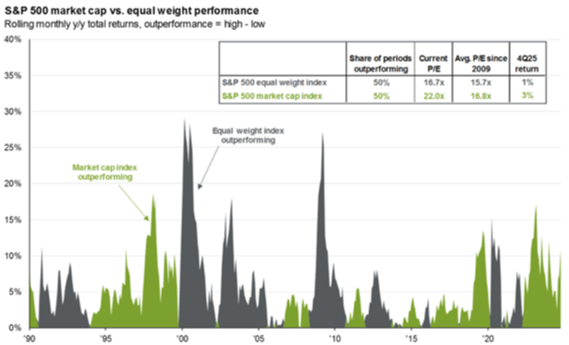
Green is market-cap outperformance, while gray is equal-weight outperformance. You can see that it typically goes in cycles where one performs better than the other. If you look at the box above, you will see that the equal-weight index is considerably cheaper than the market-cap index. We’ve talked about this before, as it is largely the Magnificent 7 that is skewing that average. The equal-weight appears to be outperforming for the month of January. Will it continue? We will have to wait to see.
Finally, there is some concern about the Japanese bond market, and how that may affect our markets.
Here is the chart of the 30 year Japanese bonds.
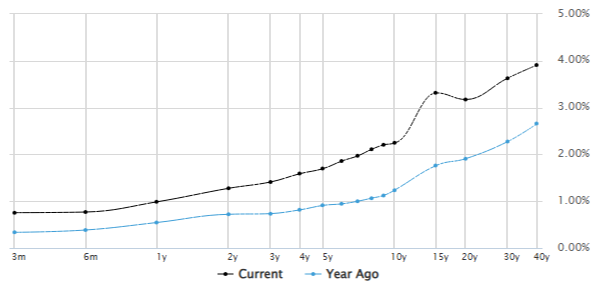
You can see that those rates have gone up by over 1% since a year ago. Will the Japanese central bank come to the rescue of their markets? We will find out. Keep in mind they are still holding their short-term rates low, but the “Bond Vigilantes” maybe forcing their hand.
It’s possible that our money flow model is picking up potential volatility from that as it echoes through the world markets. We typically won’t know the reason for volatility until after the fact. As always, we will continue to keep a close eye on things and make changes based on current and expected market conditions.
That’s it for this week. If you have any questions or comments about this or any other topic. We will certainly be happy to have a conversation.