

After taking the better part of the last month off from writing my blog, I figure we can get back into it again.
If you remember my last piece, it was just after the market had a big selloff and I wrote about the reasons for the market’s reaction. Fast forward a couple weeks and the market regained its footing and has moved back towards the recent highs.
This week is the Jackson Hole Summit, which I didn’t receive my invite for AGAIN! Remember last year we were going to crash the event? We didn’t and this year will be no different. But getting to the meat of my comments, I wanted to touch on a few things that I have discussed in the past.
The Department of Labor came out on Wednesday and slashed the number of new jobs created in the last year (through March 2024).
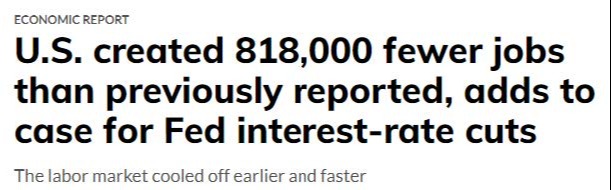
I’m pretty sure that’s what we have been saying for a while. But I don’t want to toot our own horn!
On another note, we have been talking about the ‘Magnificent 7’ and how their dominance is likely coming to an end (our opinion). But here is some data to back that up. Granted, it’s early and half of one quarter doesn’t make a trend, but it’s something.
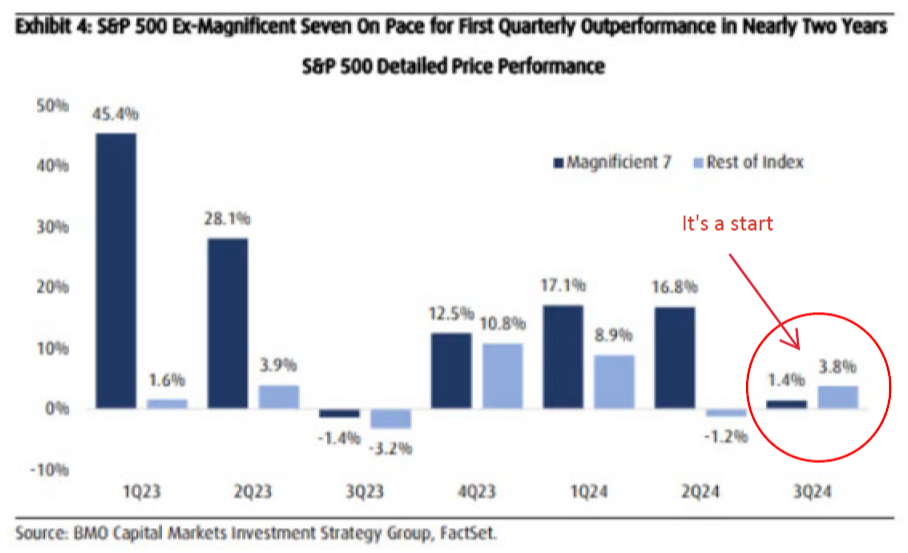
That is the first step in our opinion. Next would be for the market to broaden out to small and mid-cap stocks, which it seems to be doing in fits and starts.
We’re also seeing the dollar depreciate relative to other currencies, especially the Japanese Yen. That will likely give international markets some tailwind as well.
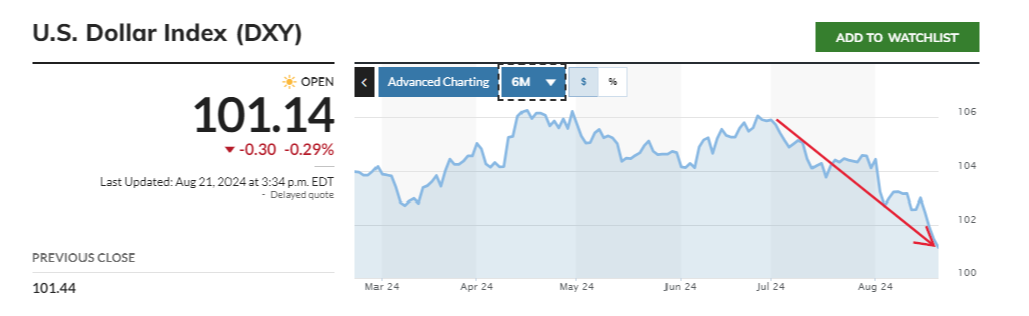
Since the beginning of July, the DXY is down roughly 5%. That doesn’t seem like much, but that’s 5% more purchasing power in foreign currencies, whether it be for US goods, real estate, stock or bonds. Things are 5% cheaper when using other currencies.
Finally, I’d like to review the pullback we had in the market and put some perspective on it. We always say a 30% bear market starts with a 5% or 10% pullback. But not every 5% or 10% pullback turns into a 30% bear market. Let’s look at some charts.
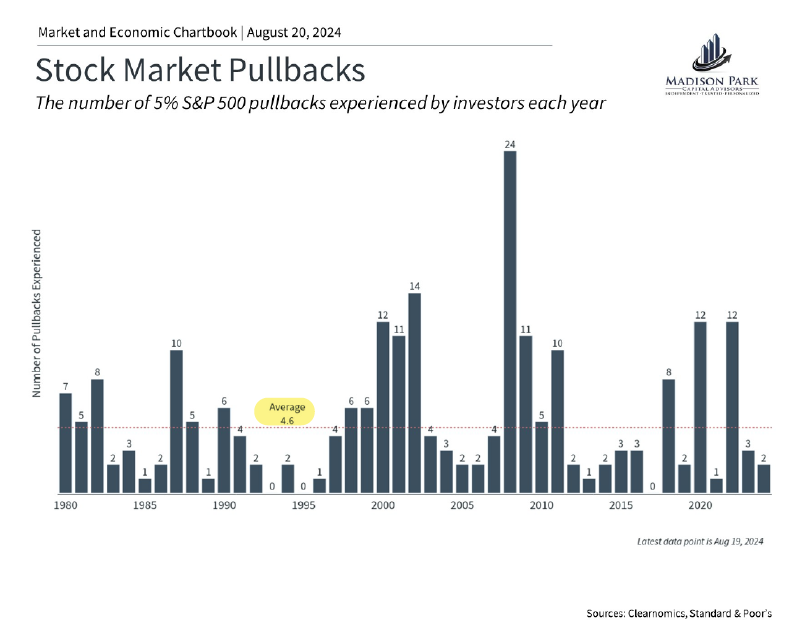
On average, the markets have 4.6 corrections of 5% per year. That’s a 5% pullback less than every three months! Obviously, some years are more than others, but that is the average going back to 1980. The median number during that timeframe is 3.
10% ‘corrections’ happen a little more than once a year.
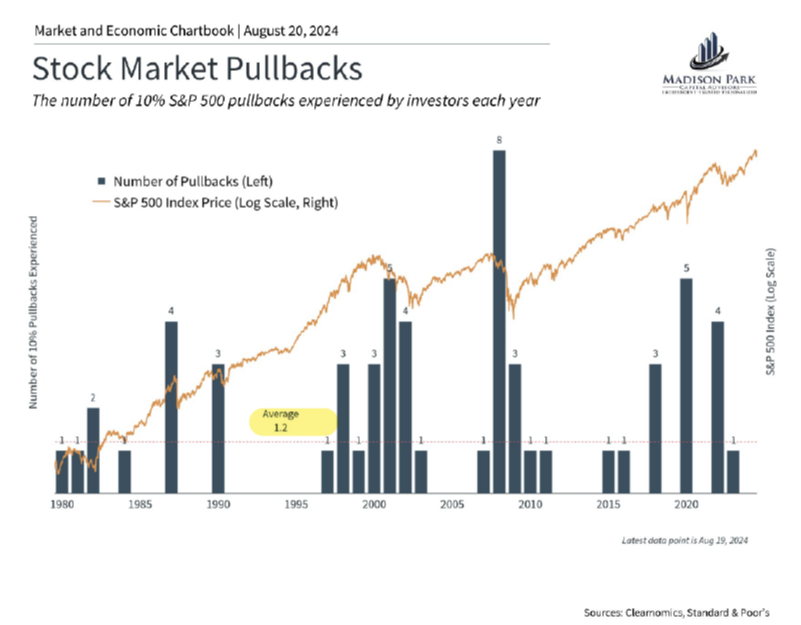
Since 1980, the markets have had nine times in a calendar year where the market has sold off 20% or more. The largest selloff in those years was 49% in 2008. I’m sure you remember that. I know I do!
So that is roughly 1 in 5 years. Some of those are your classic recessions – 1990, 2002, 2008 – but it also includes times like 1987 when we had ‘Black Monday’ and, of course, more recently the COVID crash that saw the market go down 30% in a mere 16 trading days.
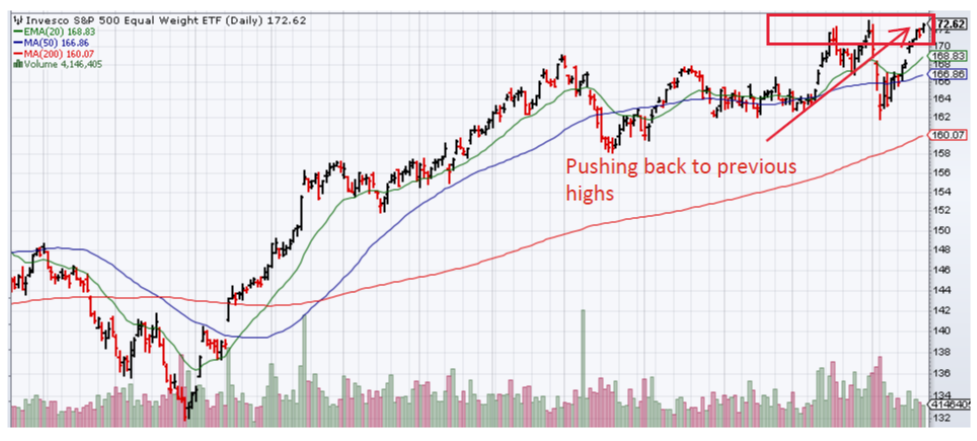
Meanwhile, our current pullback was scary for a few days, but has almost come back completely, depending on what index you are evaluating. You know our preferred index is the Equal-weighted S&P 500. It has nearly come all the way back but look at those three days in late July/early August. Felt like it was going down fast (and it was, for three days).
Nobody has a crystal ball, and nobody can do anything more than make an “educated guess” about the future. That’s what our model was intended to do. But it was never built to avoid 5% or 10% pullbacks in the market, as those happen frequently. If we built it for that, we’d never be invested in the markets.
Anyhow, I just wanted to share a few tidbits with you today. If you have questions or want more in-depth information about these issues, please reach out and we are all happy to have that conversation. I hope you have a good week.